|
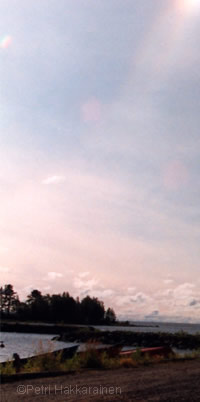
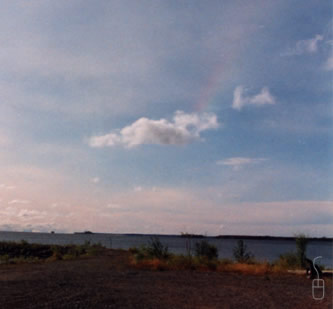
A definitive image of Lowitz arcs. Photographed
by Petri Hakkarainen at Vaala, Finland on August 31, 1994. Image ©Petri
Hakkarainen, shown with his permission.
Lowitz arcs were seen at several locations
in central Finland that day. I have increased the image contrast very slightly, that
is all, it needs no further enhancement.
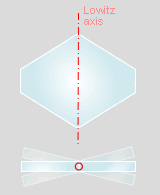
 Mouse
over for a labeled HaloSim4 simulation. Arcs from Lowitz oriented
crystals are coloured red. Mouse
over for a labeled HaloSim4 simulation. Arcs from Lowitz oriented
crystals are coloured red.
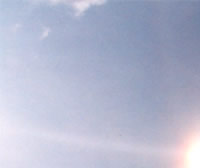
The 'ordinary' halos present are a bright right-hand parhelion,
parhelic circle and a colourful infralateral arc. There is
a hint of a 22° halo. These together
°.
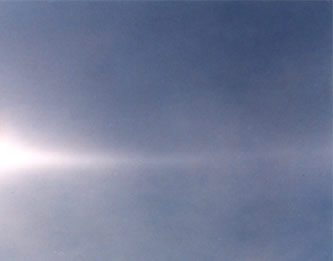
Coloured Lowitz arcs radiate from the parhelion. Present and clear are the upper, middle and lower arcs.
This image allowed theories of Lowitz formation to be much more severely tested than hitherto. Marko Riikonen et. al.* found
that the positions of the Lowitz arcs were well simulated by the classical
model of regular hexagonal plates taking all orientations about the
Lowitz axis. Then the problems started. The simulations did not reproduce
the relative
intensities of the three arcs. The middle arc is very much brighter In
Hakkarainen's image than in simulations. Variations in crystal concentration
across the sky could not be invoked because the arcs are close together.
Other effects like imperfections within the crystals or limitations in computing
intensities in the simulations might have had effects but could not convincingly
account for the large differences.
Riikonen et.al. reasoned that a brighter middle arc would
be produced if the crystals were not regular hexagons but more
rhombus shaped. This allows more middle arc forming rays to be
transmitted. Of course, the interfacial angles stay at 120°.
The other innovation was to use crystals tilted through a limited
range of angles about the Lowitz axis. These factors allowed
an accurate simulation of the display. Ad hoc explanations
rarely find much favour but the case is strengthened in that
they found that several other clearly defined Lowitz displays
also required similar crystals and limited tilts to reproduce
them. Furthermore, semi-regular crystals have been sampled in
other (non Lowitz) halo displays. We need crystals sampled from
actual Lowitz displays.
The simulation shown here was for red light of wavelength 610 nm
and was matched against the red side of the arcs. The hexagonal
plate Lowitz crystals were as at left and had limited tilts
about their Lowitz axis of 15° standard deviation from
horizontal. This simulation is meant to be indicative rather than definitive.
Riikonen et. al. have reproduced the display better with a more physically realistic range of
crystal shapes each with its distribution of tilt angles.
* |
Riikonen,
M., Cowley, L., Schroeder, M., Pekkola, M, Öhman, T.
and Hinz, C.,
The Lowitz Arcs,
Weather, September 2007, Vol.62, No.9, pp252-6 |
|